Simulated data files
Data:
- The reflectances were created like so: Rho_TOA = Rho_atm + ( Tsz * Tvz * RwMorel(0+,chla) )
- Note that here RwMorel(0+,chla) = 0.524 * RwMorel(0-,chla)
- The reflectances in the files were generated at 10 wavelengths: 400, 407, 435, 485, 505, 549, 667, 766, 866, 913 nm.
- Each file contains these columns of data: phi, muv, mus, wind speed (m/s), aerosol scale height (km), aerosol type1, aerosol type2, optical thickness of aerosol type 1, optical thickness of aerosol type 2; Rho_TOA and Rho_atm and Tsz*Tvz at the 10 wavelengths
- phi = relative azimuth (degrees), where the convention is phi=0 corresponds to forward scattering and phi=180 to backscattering
- muv = COS( viewing zenith ), mus = COS( solar zenith )
- Tsz = total transmittance associated with the solar zenith, Tvz = that for the viewing zenith
- There are 4 simulated data files (each is 12 Mb in size), each file was created with a different level of Chlorophyll, chla = ( 0.03, 0.3, 3.0, 30.0 mg/m^3 ).
- Chla=0.03, file,
Rw_Morel(0+,c=0.03) = 0.058222760, 0.059098673, 0.045044687, 0.020926049, 0.011187412, 0.0041700298, 0.00028840837, 0.0, 0.0, 0.0
- Chla=0.3, file,
Rw_Morel(0+,c=0.3) = 0.021144513, 0.019849278, 0.016840506, 0.014836456, 0.011501072, 0.0065305941, 0.00071164053, 0.0, 0.0, 0.0
- Chla=3.0, file,
Rw_Morel(0+,c=3.0) = 0.0090108159, 0.0083492410, 0.0076369196, 0.0094574063, 0.010087540, 0.010820396, 0.0021921977, 0.0, 0.0, 0.0
- Chla=30.0, file,
Rw_Morel(0+,c=30.0) = 0.0049203366, 0.0045569870, 0.0042552378, 0.0056860490, 0.0067126235, 0.010442050, 0.0039652898, 0.0, 0.0, 0.0
- Rmol data corresponding to each line of the above files:
file
Satellite Data:
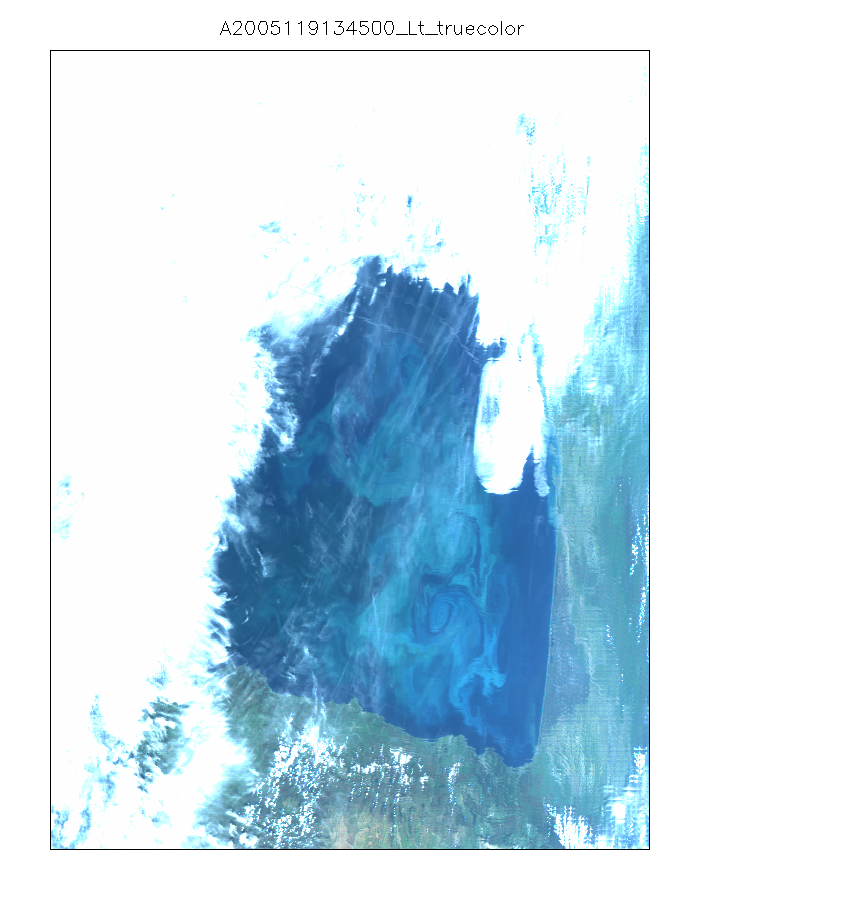
- Bay of Biscay, France, MODIS Aqua, 29 April 2005, LAC, A2005119134500:
- original Level 1A datafile from Oceancolor website (HDF format, SDS structure)
- The L1A data was processed to L1B via seaDAS, then further processed to L2 selecting many parameters, such as Lt, rhot, Rrs, aot, angstrom, ozone, windspeed, water_vapor, pressure, relaz, solz, senz, etc.
- for spectral data, wavelengths selected are: 412, 443, 488, 531, 547, 667, 678, 748, 869
- Subset selected from this swath is 600 samples by 800 lines. Samples are taken from pixels 755 to 1354, and lines are taken from pixels 1081 to 1880 from the full MODIS swath.
- Truecolor image of selected area
- Data file containing Tc, simple binary flat file, 600 samples by 800 lines, first line should be northern-most latitude, single precision floating point data, typical valid values in range [0.0, 2.0]
- Data file containing land/cloud/ocean mask, simple binary flat file, 600 samples by 800 lines, first line should be northern-most latitude, byte values, 0=ocean 1=land 2=cloud, cloud mask generated for Ref_TOA(748) >= 28.0
Robert Frouin, PI (RFrouin@UCSD.edu)
John McPherson, programmer (JMcPherson@UCSD.edu)